
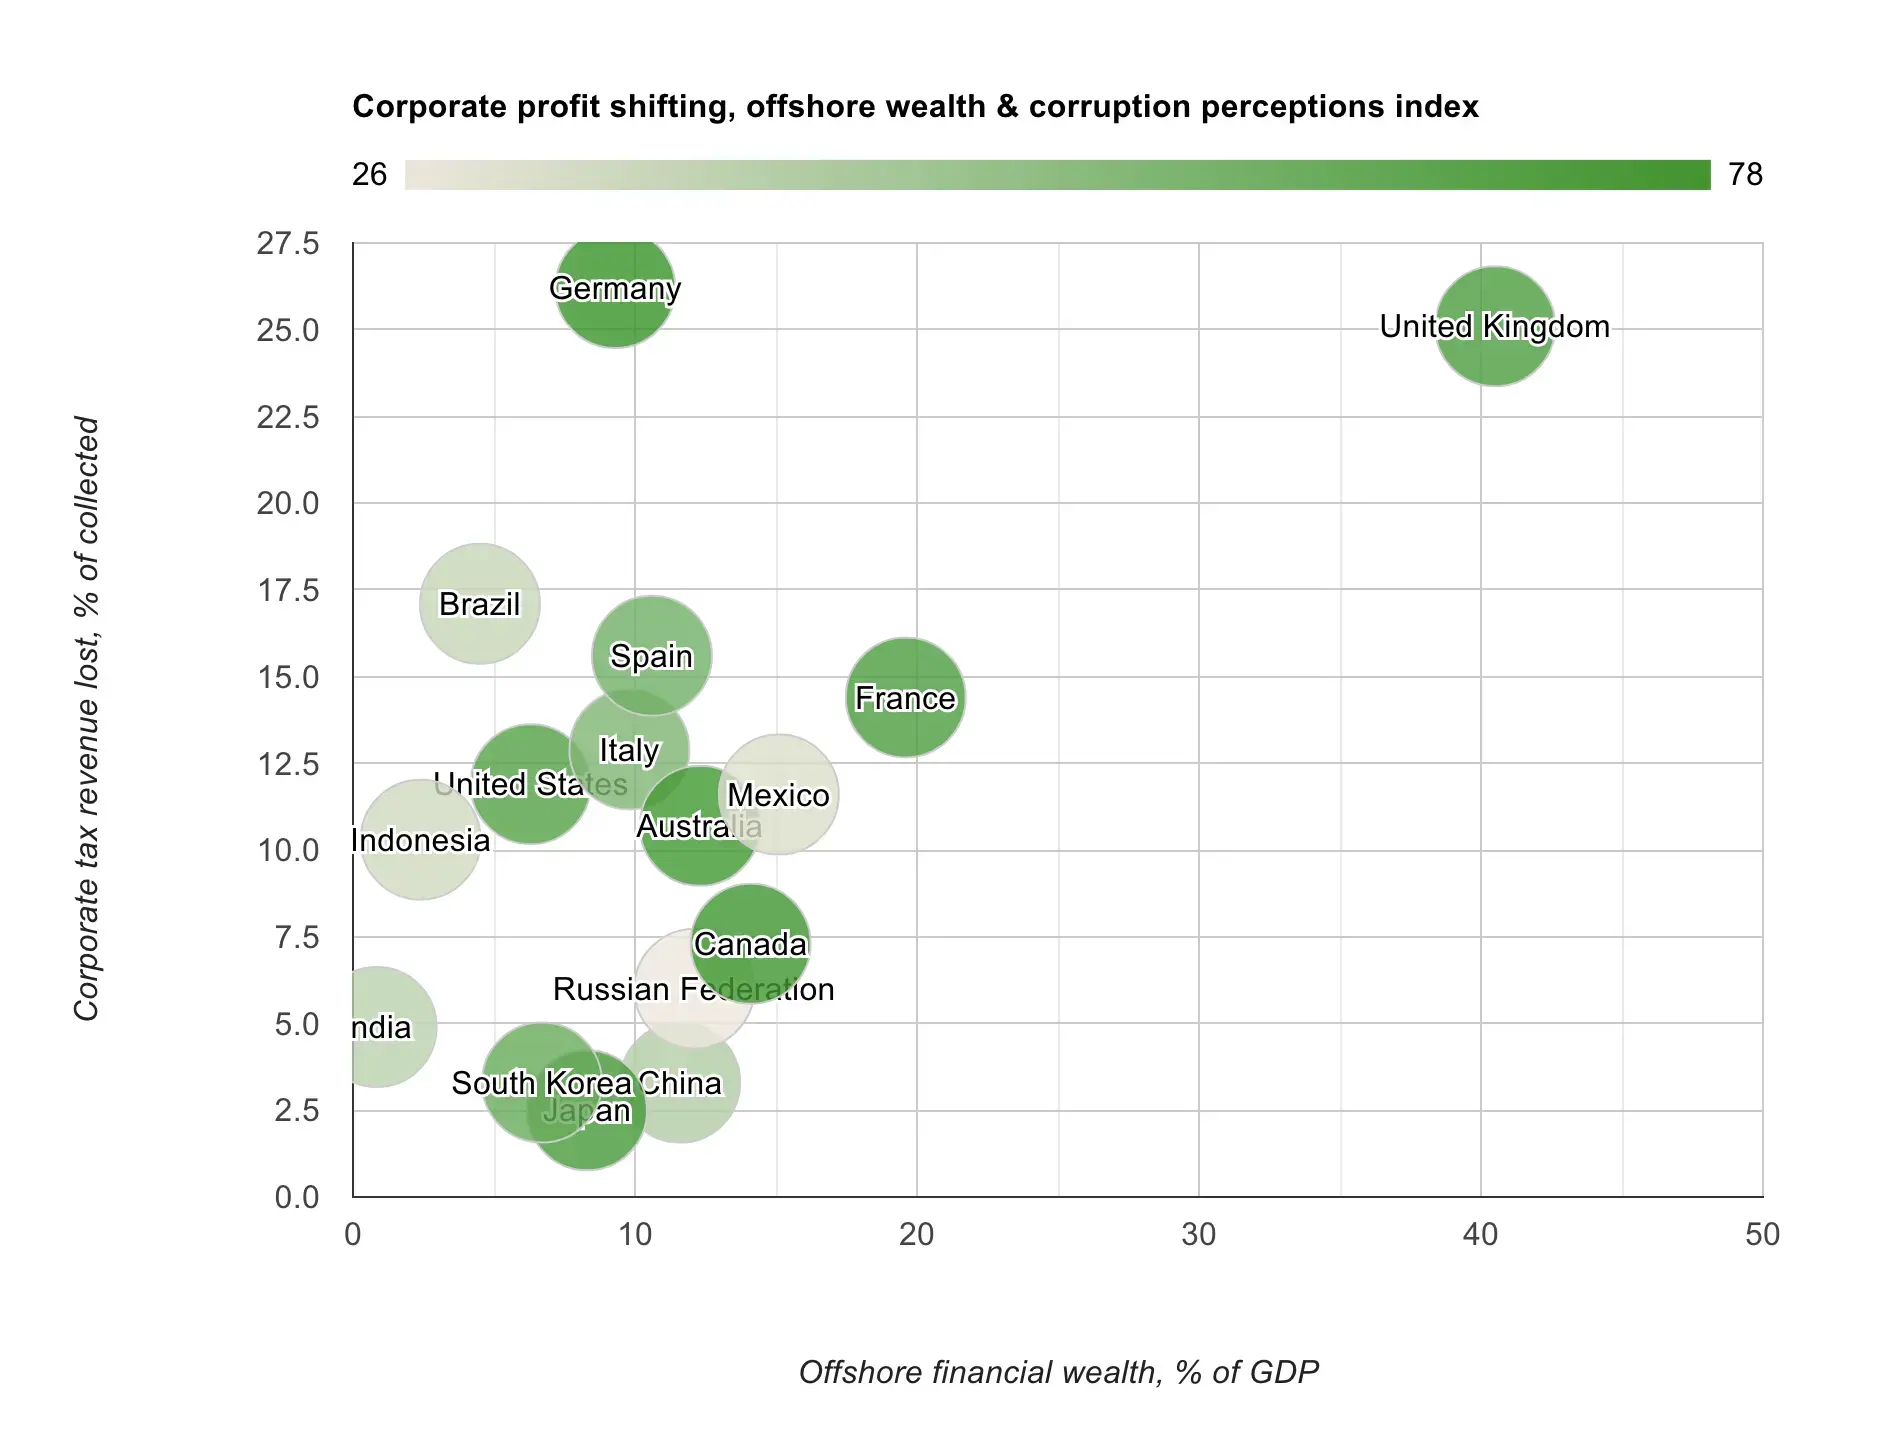
This chart would be more readable if the corruption perception index were explained by having the polarity of the scale labeled. I.e. is green “corrupt” or not?
By following the source link, it looks like green = “clean” and gray = “corrupt”.
Germany showing the UK, that you don’t need to offshore to evade taxes?
Armchair geopolitics explanation: it’s a culture/societal difference between a thousand year old monarchy and a federalist state that lost 2 world wars on their own land. Not to mention the federalist state had a “communist” power structure in control of about half of their lands for half a century while the other half birthed a regional free trade juggernaut. Meanwhile, the monarchy has a landed elite class/aristocracy that persists to this day.
What I’m getting at is that the wealth in the UK could be much more heavily tied up in individual fortunes and estates than the wealth in Germany. That kind of wealth seems easier to “protect” by offshoring (and/or the UK has evolved to prefer/rely on it).
In contrast, I expect the wealth in Germany to be more tied up in corporations, stocks, etc. This in turn would lend itself to corporate forms of tax evasion that can happen domestically.
Part of it could also be that Germany is exporting a lot of goods, so the wealth is accumulated in Germany but the profits are realized abroad, lending itself to the tax evasion. This situation is probably a result of what you described.
Ooh, good point.
I don’t fully understand, but boy is that graph pretty B)


