@data_graffiti@beehaw.org to World News@beehaw.org • 1 month agoLarge economies offshore wealth & corruption perceptionsbeehaw.orgimagemessage-square6fedilinkarrow-up141arrow-down10file-text
arrow-up141arrow-down1imageLarge economies offshore wealth & corruption perceptionsbeehaw.org@data_graffiti@beehaw.org to World News@beehaw.org • 1 month agomessage-square6fedilinkfile-text
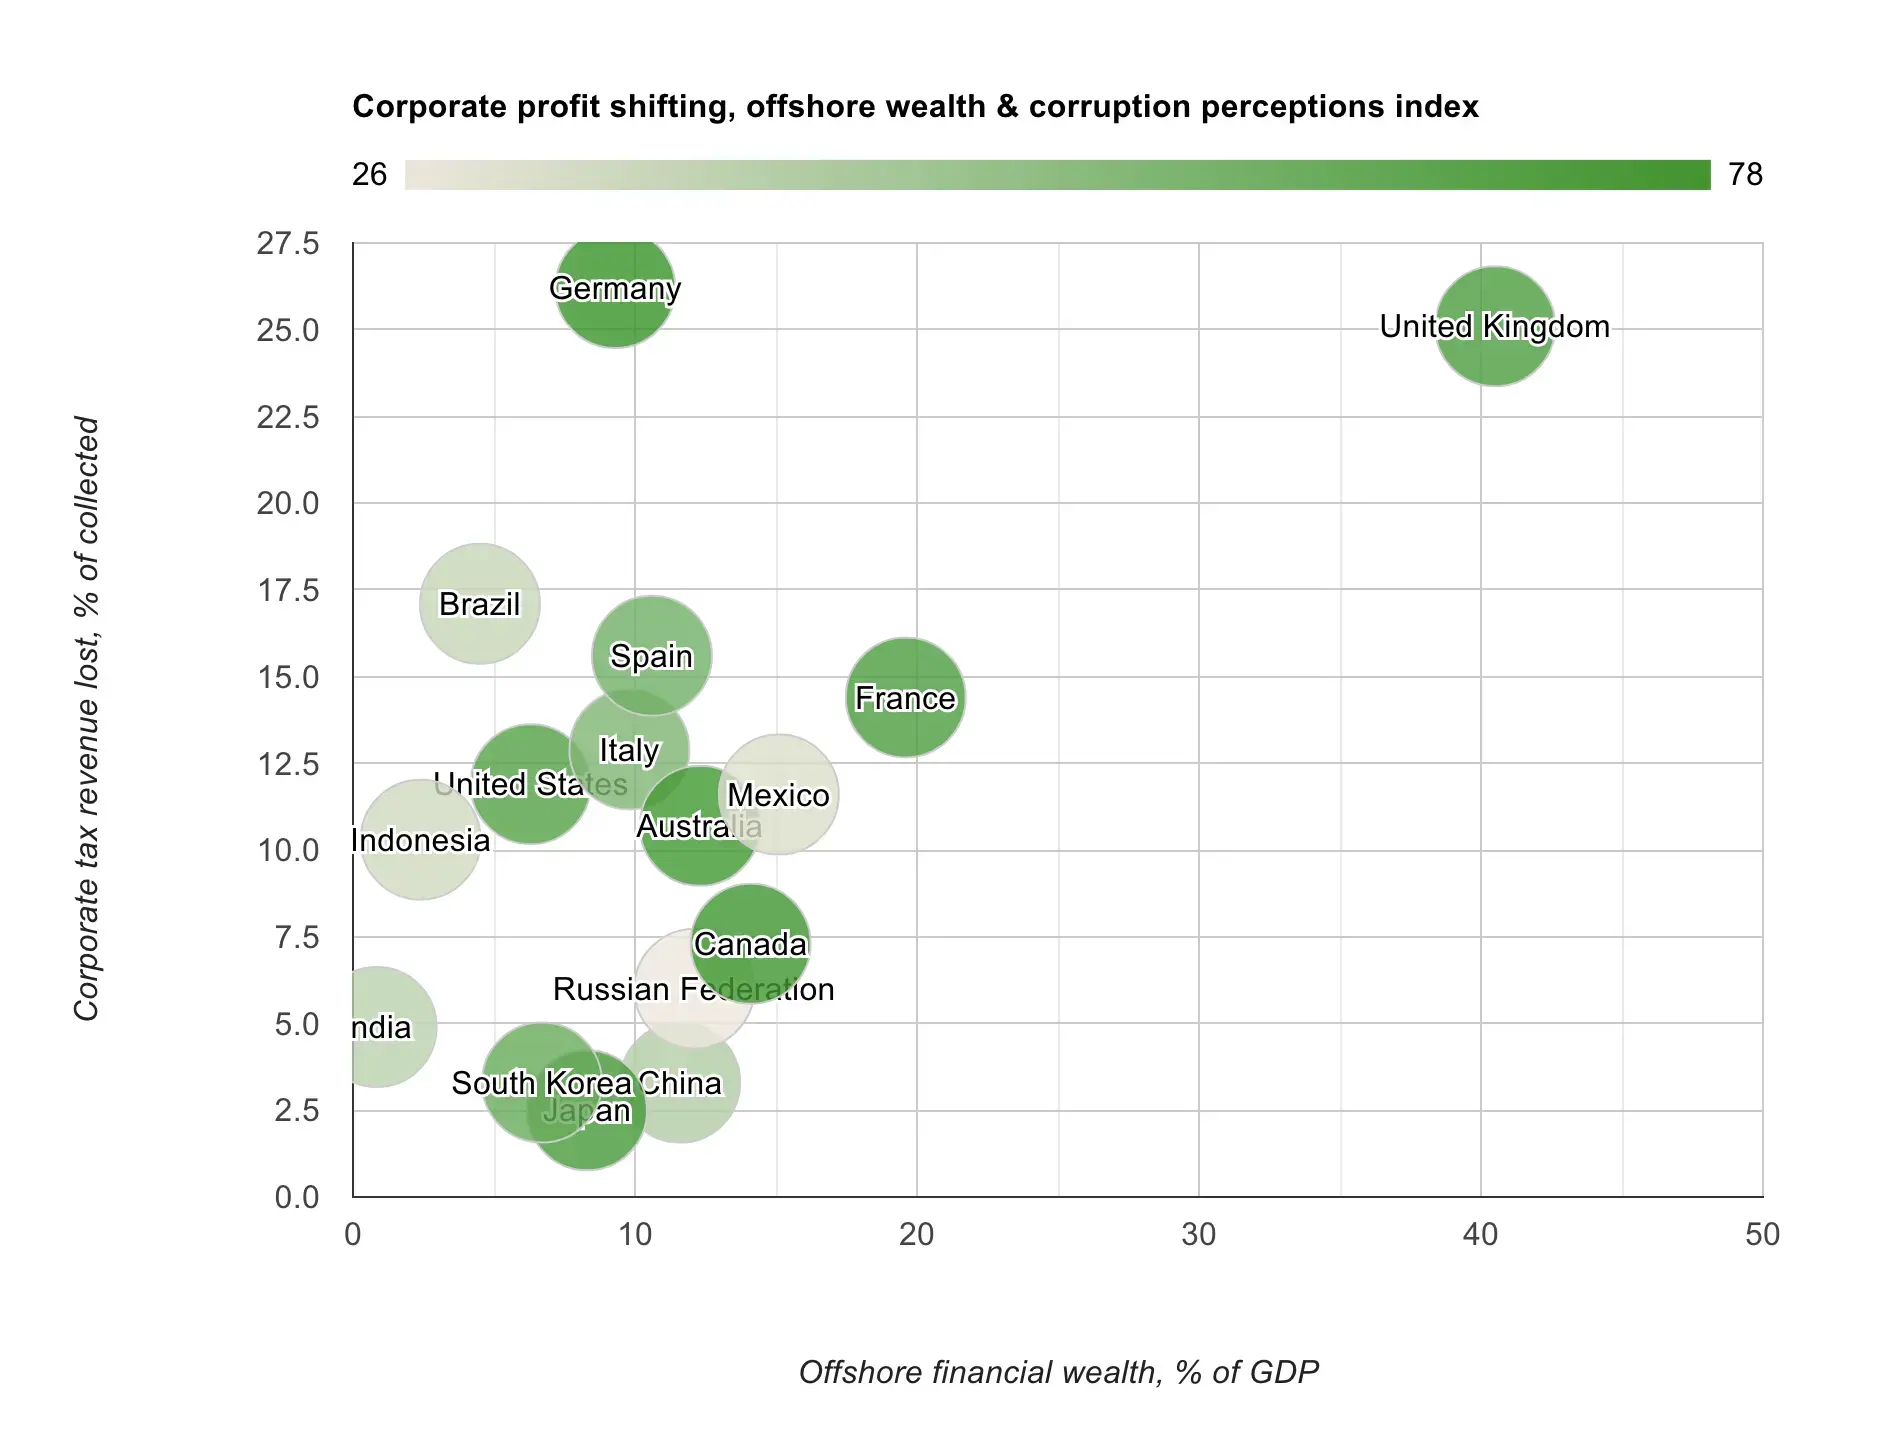
minus-square@tatterdemalion@programming.devcakelinkfedilink7•edit-21 month agoThis chart would be more readable if the corruption perception index were explained by having the polarity of the scale labeled. I.e. is green “corrupt” or not? By following the source link, it looks like green = “clean” and gray = “corrupt”.

This chart would be more readable if the corruption perception index were explained by having the polarity of the scale labeled. I.e. is green “corrupt” or not?
By following the source link, it looks like green = “clean” and gray = “corrupt”.