@ElCanut to Data is Beautiful@lemmy.worldEnglish • 3 months agoConceptualimagemessage-square20arrow-up1213arrow-down111
arrow-up1202arrow-down1imageConceptual@ElCanut to Data is Beautiful@lemmy.worldEnglish • 3 months agomessage-square20
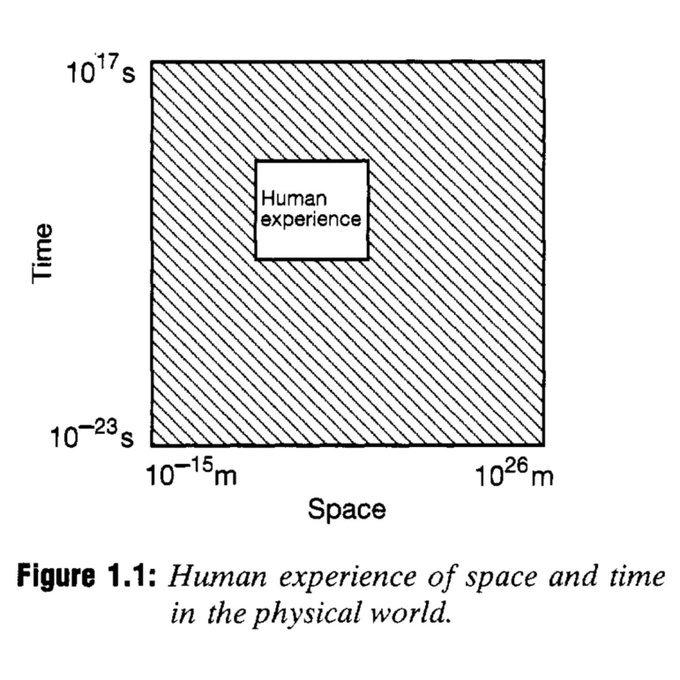
minus-square@zero_spelled_with_an_ecks@programming.devlinkfedilinkEnglish3•3 months agoCouldn’t one figure it out based on the box being signed slightly to the left of and above center?
minus-square@Droggelbecher@lemmy.worldlinkfedilinkEnglish10•3 months agoI mean yeah, with prior knowledge of/ intuition for the data. Which in general shouldn’t be presumed when presenting a graph. But I’m being nit picky
minus-square@PrinceWith999Enemies@lemmy.worldlinkfedilinkEnglish4•3 months agoThat’s not being nit picky at all in my opinion. The chart is objectively terrible. I’d be Reviewer Number 2 on this one.
Couldn’t one figure it out based on the box being signed slightly to the left of and above center?
I mean yeah, with prior knowledge of/ intuition for the data. Which in general shouldn’t be presumed when presenting a graph. But I’m being nit picky
That’s not being nit picky at all in my opinion. The chart is objectively terrible. I’d be Reviewer Number 2 on this one.