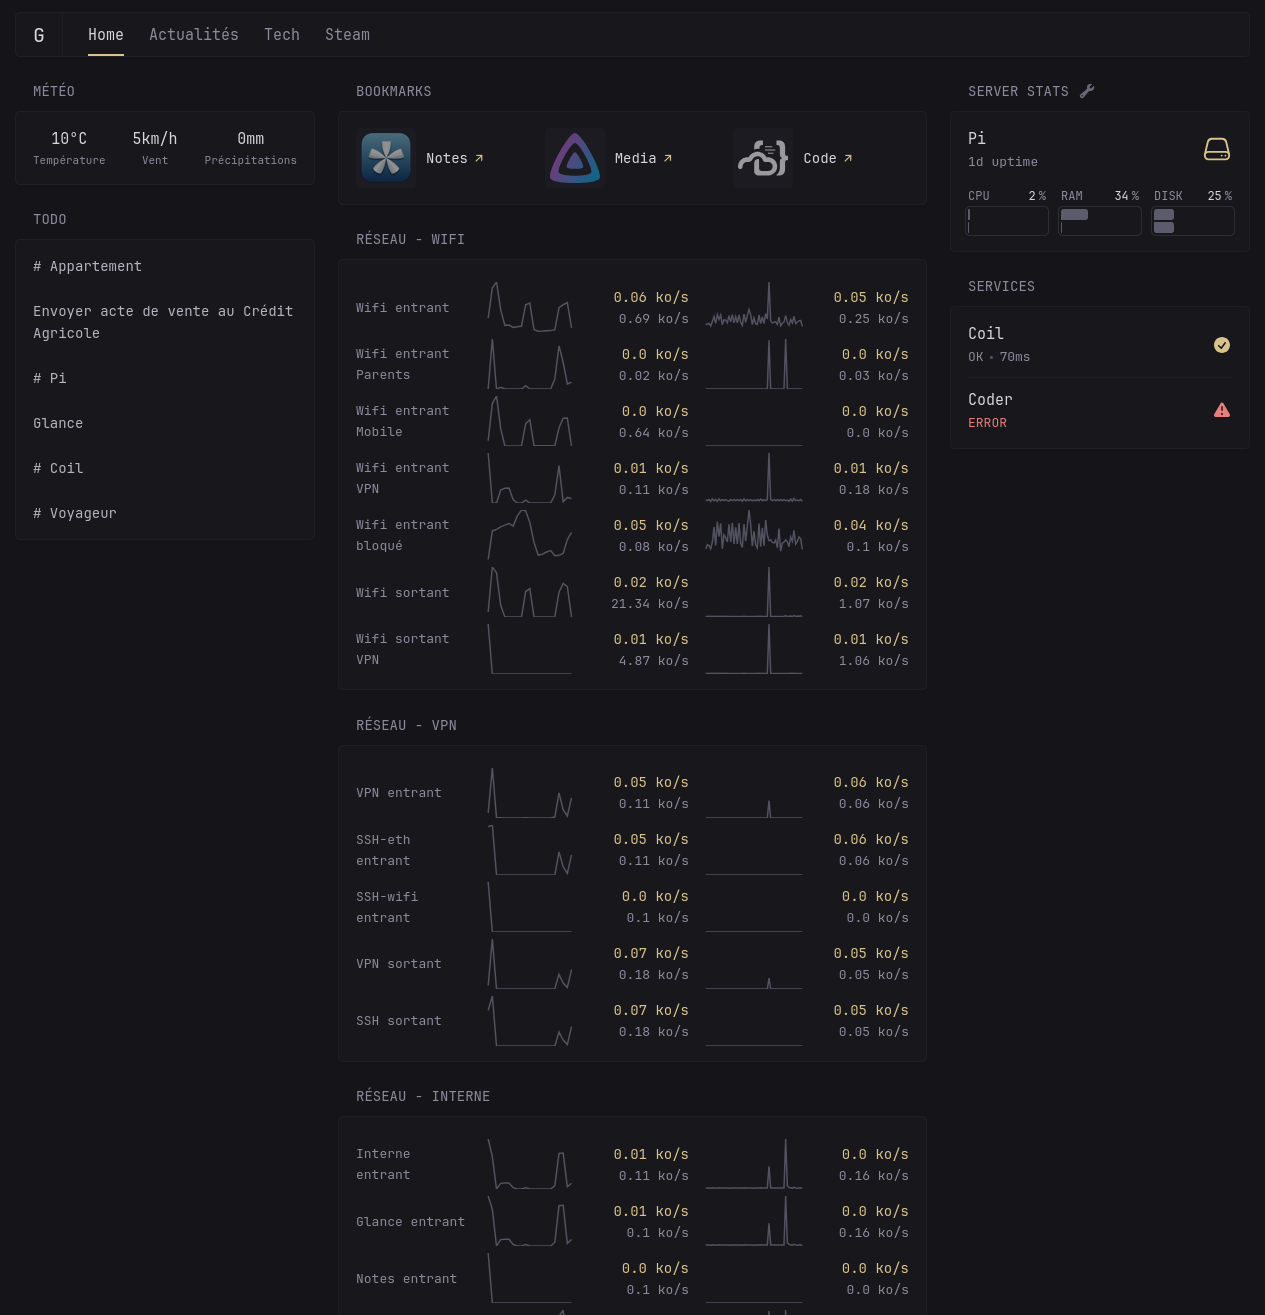
I spent some time learning and configuring my firewall, then displayed it in form of SVG graph on Glance. I’m pretty happy about the result so I wanted to share it :)

  • MouetteOP
    link
    fedilink
    English
    arrow-up
    2
    ·
    edit-2
    3 days ago

    Yes the full recipe is:

    • 1 Flask API for sending custom HTML to Glance
    • 1 systemd unit + python script for the right graph (last 60 minutes, resetting counter and collecting data via nftables python module)
    • 1 systemd unit + python script for the left graph (last 24h, aggregate data from the last hour collevted by the first script And that’s it, the systemd units are used to schedule python scripts and all the data are stored in flat csv file (forgot one bash script +systemd unit to to flush docker rules at boot and apply custom ones)