jlai.lu
  • Communities
  • Create Post
  • Create Community
  • heart
    Support Lemmy
  • search
    Search
  • Login
  • Sign Up
ElCanut to Data is Beautiful@lemmy.worldEnglish · 1 年前

Conceptual

external-link
message-square
20
link
fedilink
204
external-link

Conceptual

ElCanut to Data is Beautiful@lemmy.worldEnglish · 1 年前
message-square
20
link
fedilink
alert-triangle
You must log in or register to comment.
  • kakes@sh.itjust.works
    link
    fedilink
    English
    arrow-up
    48
    ·
    1 年前

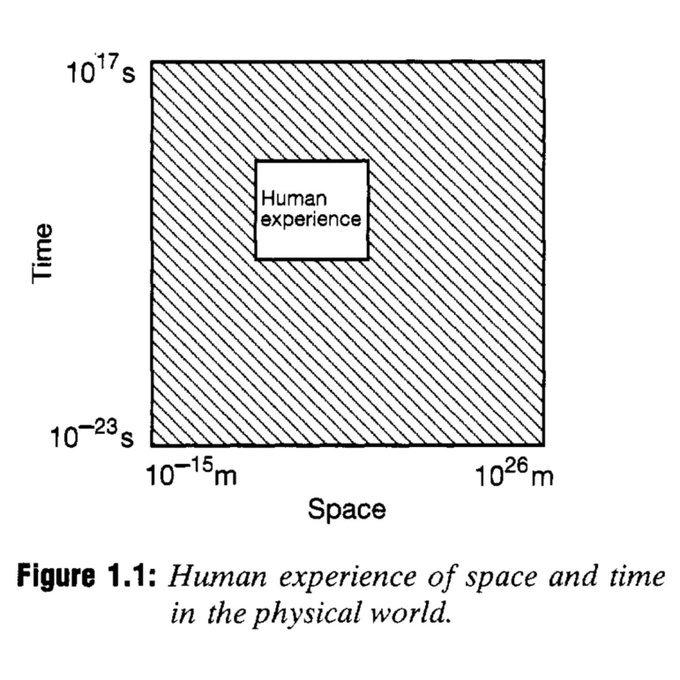
    That white box seems waaaay too big to me.

    • wizzor@sopuli.xyz
      link
      fedilink
      English
      arrow-up
      19
      ·
      1 年前

      I thought so too, but its log scale, so who knows.

    • circuitfarmer@lemmy.sdf.org
      link
      fedilink
      English
      arrow-up
      16
      ·
      1 年前

      Also remember that the longest distance you’ve ever traveled is an unknown quantity but guaranteed to be huge, since the earth itself is careening through space

    • ShittyBeatlesFCPres@lemmy.world
      link
      fedilink
      English
      arrow-up
      2
      ·
      1 年前

      Maybe it counts what we’ve explored via telescopes? Like, JWST can look far back at specific things and all-sky surveys only look so far.

  • Patapon Enjoyer@lemmy.world
    link
    fedilink
    English
    arrow-up
    46
    ·
    1 年前

    The logiest of scales

    • Droggelbecher@lemmy.world
      link
      fedilink
      English
      arrow-up
      26
      ·
      1 年前

      With only two numbers written down we technically don’t know whether it’s linear or log

      • zero_spelled_with_an_ecks@programming.dev
        link
        fedilink
        English
        arrow-up
        4
        arrow-down
        1
        ·
        1 年前

        Couldn’t one figure it out based on the box being signed slightly to the left of and above center?

        • Droggelbecher@lemmy.world
          link
          fedilink
          English
          arrow-up
          10
          ·
          1 年前

          I mean yeah, with prior knowledge of/ intuition for the data. Which in general shouldn’t be presumed when presenting a graph. But I’m being nit picky

          • PrinceWith999Enemies@lemmy.world
            link
            fedilink
            English
            arrow-up
            4
            ·
            1 年前

            That’s not being nit picky at all in my opinion. The chart is objectively terrible. I’d be Reviewer Number 2 on this one.

      • tomi000@lemmy.world
        link
        fedilink
        English
        arrow-up
        1
        arrow-down
        1
        ·
        edit-2
        1 年前

        If its linear the Human Experience is located around -5*10^22s - -3*10^22s and 3*10^25m - 6*10^25m (whatever that would even be supposed to mean).

        Doesnt seem right to me. But yes, technically youre right

  • Gork@lemm.ee
    link
    fedilink
    English
    arrow-up
    11
    ·
    1 年前

    But don’t we all want to experience 10^26 m?

    • perviouslyiner@lemmy.world
      link
      fedilink
      English
      arrow-up
      2
      ·
      1 年前

      JWST has some pictures of it

    • Acters@lemmy.world
      link
      fedilink
      English
      arrow-up
      1
      ·
      1 年前

      Some are looking at 10^-15 for the answers too

  • not_woody_shaw@lemmy.world
    link
    fedilink
    English
    arrow-up
    11
    ·
    1 年前

    I was expecting something a little more circular, tbh.

    • nfh@lemmy.world
      link
      fedilink
      English
      arrow-up
      11
      ·
      1 年前

      So a box means that the duration of time doesn’t affect the lengths we can perceive, and the sizes don’t affect the duration of time we can observe something.

      A circle would imply that the amount of time we perceive something affects the scales we can perceive, and most weirdly of all, vice-versa.

      • ProfessorProteus@lemmy.world
        link
        fedilink
        English
        arrow-up
        2
        ·
        1 年前

        The circle sounds like a really interesting—if mind-bending—science fiction book. If it was written well enough I’d give it a shot, even if I can’t intuit what’s going on.

    • zero_spelled_with_an_ecks@programming.dev
      link
      fedilink
      English
      arrow-up
      4
      ·
      1 年前

      Like the dot of the i of Jeremy Bearimy?

    • lemmyman@lemmy.world
      link
      fedilink
      English
      arrow-up
      1
      ·
      1 年前

      I was thinking maybe donut-shaped

  • OpenStars@startrek.website
    link
    fedilink
    English
    arrow-up
    3
    ·
    1 年前

    B-b-but, surely things so small or far away could never impact us!? (/s :-P)

  • affiliate@lemmy.world
    link
    fedilink
    English
    arrow-up
    1
    ·
    1 年前

    i’ll take this over the universe cone thing

Data is Beautiful@lemmy.world

dataisbeautiful@lemmy.world

Subscribe from Remote Instance

Create a post
You are not logged in. However you can subscribe from another Fediverse account, for example Lemmy or Mastodon. To do this, paste the following into the search field of your instance: !dataisbeautiful@lemmy.world

A place to share and discuss visual representations of data: Graphs, charts, maps, etc.

DataIsBeautiful is for visualizations that effectively convey information. Aesthetics are an important part of information visualization, but pretty pictures are not the sole aim of this subreddit.

A place to share and discuss visual representations of data: Graphs, charts, maps, etc.

  A post must be (or contain) a qualifying data visualization.

  Directly link to the original source article of the visualization
    Original source article doesn't mean the original source image. Link to the full page of the source article as a link-type submission.
    If you made the visualization yourself, tag it as [OC]

  [OC] posts must state the data source(s) and tool(s) used in the first top-level comment on their submission.

  DO NOT claim "[OC]" for diagrams that are not yours.

  All diagrams must have at least one computer generated element.

  No reposts of popular posts within 1 month.

  Post titles must describe the data plainly without using sensationalized headlines. Clickbait posts will be removed.

  Posts involving American Politics, or contentious topics in American media, are permissible only on Thursdays (ET).

  Posts involving Personal Data are permissible only on Mondays (ET).

Please read through our FAQ if you are new to posting on DataIsBeautiful. Commenting Rules

Don't be intentionally rude, ever.

Comments should be constructive and related to the visual presented. Special attention is given to root-level comments.

Short comments and low effort replies are automatically removed.

Hate Speech and dogwhistling are not tolerated and will result in an immediate ban.

Personal attacks and rabble-rousing will be removed.

Moderators reserve discretion when issuing bans for inappropriate comments. Bans are also subject to you forfeiting all of your comments in this community.

Originally r/DataisBeautiful

Visibility: Public
globe

This community can be federated to other instances and be posted/commented in by their users.

  • 1 user / day
  • 3 users / week
  • 842 users / month
  • 3.96K users / 6 months
  • 8 local subscribers
  • 5.96K subscribers
  • 113 Posts
  • 2.28K Comments
  • Modlog
  • mods:
  • Tuvan41@lemmy.world
  • Striker@lemmy.world
  • the_ocs@lemmy.world
  • BE: 0.19.11
  • Modlog
  • Legal
  • Instances
  • Docs
  • Code
  • join-lemmy.org